Parsing User Agent strings from Packetbeat
by Andrew Kroh
Packetbeat is a open source tool from Elastic (the makers of Elasticsearch) that analyzes network traffic in real-time and stores the data in Elasticsearch. You can collect some interesting data if you install Packetbeat in a location where it can see all the traffic between your network and the Internet. I use a SPAN port on a Cisco switch to mirror my network's traffic into Packetbeat.
To get an overview of the various operating systems and browsers being used on a
network you can configure Packetbeat to collect all HTTP traffic including the
User-Agent request header. Packetbeat collects the raw user agent string which
needs to be parsed and normalized in order to analyze which OSes and browsers
are being used. Parsing of the user agent strings can be performed by
Logstash (another product by
Elastic).
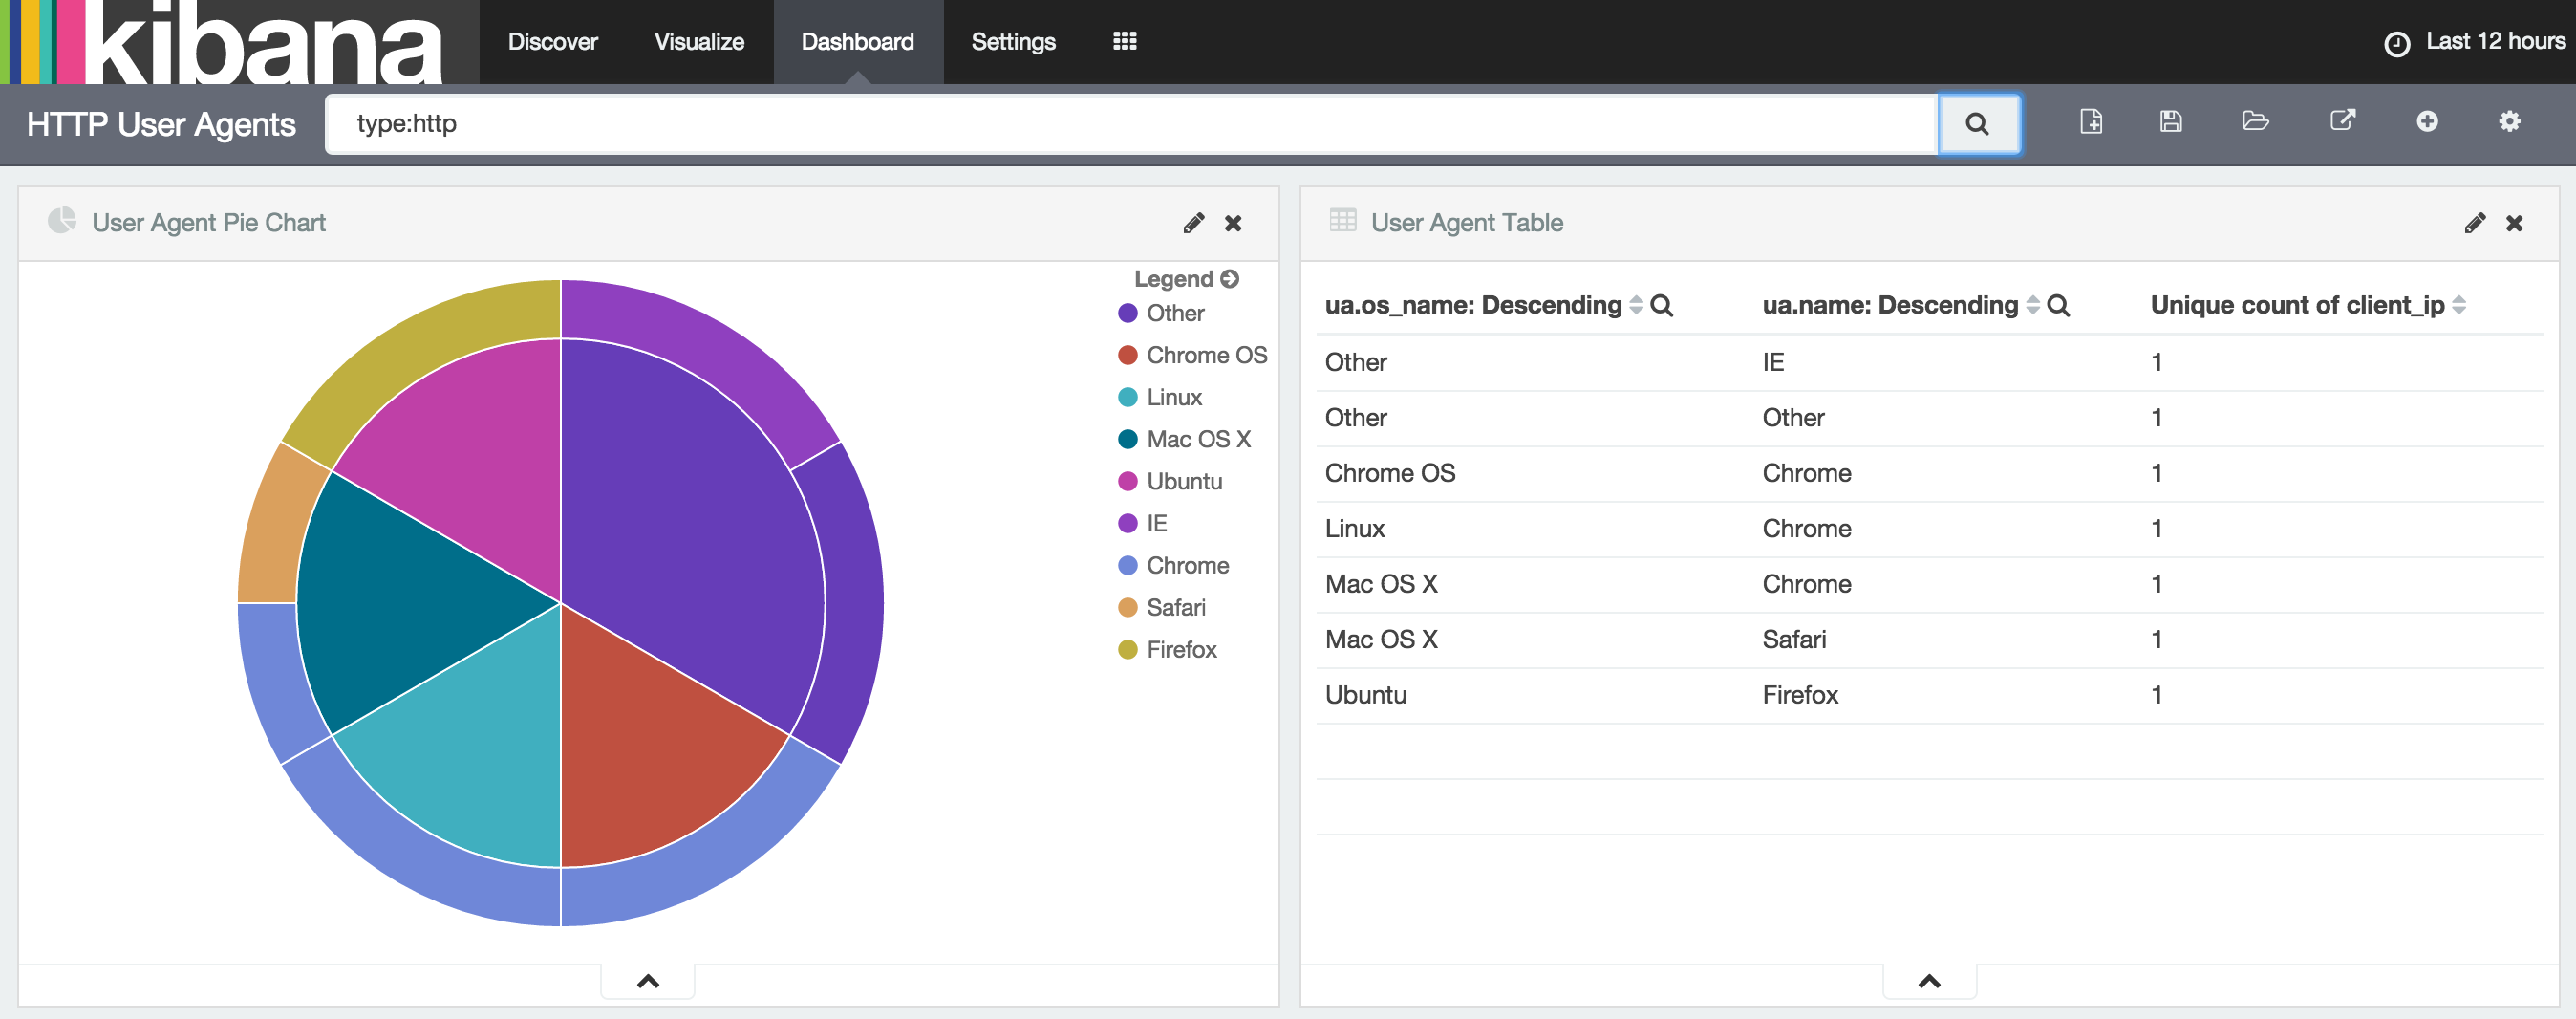
Once you are collecting data you can easily visualize and explore it using Kibana.
The data flow through my setup is Packetbeat -> Logstash -> Elasticsearch. Below I will show example configurations that can be used for this task.
Packetbeat Configuration
interfaces:
  device: eth1
  with_vlans: true

protocols:
  http:
    ports: [80, 8080, 8000, 000, 8002]
    send_headers: ["User-Agent"]

output:
  logstash:
    hosts: ["localhost:5044"]

logging:
  to_files: true
  files:
    path: /var/log/packetbeat
    name: packetbeat.log
  level: info
Logstash Configuration
input {
  beats {
    port => 5044
  }
}

filter {
  if [type] == "http" {
    useragent {
      # Read the user-agent field from the JSON sent by Packetbeat
      source => "[http][request_headers][user-agent]"
      # Remove the raw request_headers since we don't need them after reading
      # the user-agent string.
      remove_field => "[http][request_headers]"
      # Put all the of parsed user-agent data under the "ua" key.
      target => "ua"
    }
  }
}

output {
  # I am using 'Found' which is Elastic's hosted Elasticsearch offering.
  elasticsearch {
    hosts => "xyz.us-west-1.aws.found.io:9243"
    ssl => true
    user => "readwrite"
    password => "password"
    manage_template => false
    index => "%{[@metadata][beat]}-%{+YYYY.MM.dd}"
    document_type => "%{[@metadata][type]}"
  }
}
Example Output
The document that is indexed in Elasticsearch now includes a ua field that
holds all of the parsed user-agent data.
{
  "@timestamp": "2016-01-24T20:08:37.193Z",
  "beat": {
    "hostname": "beats",
    "name": "beats"
  },
  "bytes_in": 185,
  "bytes_out": 367,
  "client_ip": "10.10.0.18",
  "client_port": 36801,
  "client_proc": "",
  "client_server": "",
  "count": 1,
  "direction": "out",
  "http": {
    "code": 301,
    "content_length": 148,
    "phrase": "Permanently",
    "response_headers": {}
  },
  "ip": "23.7.122.8",
  "method": "GET",
  "params": "",
  "path": "/",
  "port": 80,
  "proc": "",
  "query": "GET /",
  "responsetime": 45,
  "server": "",
  "status": "OK",
  "type": "http",
  "@version": "1",
  "host": "beats",
  "tags": [
    "beats_input_raw_event"
  ],
  "ua": {
    "name": "Chrome",
    "os": "Mac OS X 10.6.8",
    "os_name": "Mac OS X",
    "os_major": "10",
    "os_minor": "6",
    "device": "Other",
    "major": "12",
    "minor": "0",
    "patch": "742"
  }
}
Subscribe via RSS